

Are business analytics dashboards worth it? In a word: yes. As an e-commerce business, it's important to have a reporting dashboard set up to track your progress and identify any areas that need improvement. But what exactly should you include in your e-commerce dashboard? And why do you need one?
In this blog post, we'll answer those questions and give you some best practices for creating an e-commerce reporting dashboard for your business. All you need is a spreadsheet and your data sources.
Why have a business analytics dashboard?
Every business needs to know how successful its efforts are but you can’t track what you don’t measure. Dashboards allow you to know what you are doing well and what you need to improve. You can see whether the changes to your business are making a difference, or not, and what areas are doing well. A reporting dashboard allows you to track your company's performance over time, compare data between different periods, and see how you're doing against your goals. They're also great to show your boss or team how your business is doing!
Some of the benefits of using a reporting dashboard include:
- Seeing a clear overview of your company's performance
- Tracking progress over time
- Comparing data between different periods
- Visualizing data in an easy-to-understand way
- Making better-informed decisions for your business
Now, Let's take a look at what you should include in your dashboard. Then we'll give you some tips on how to set it up.
What should be in your reporting dashboard?
If you are an e-commerce business there are a few key things that you should track in your dashboard. These include:
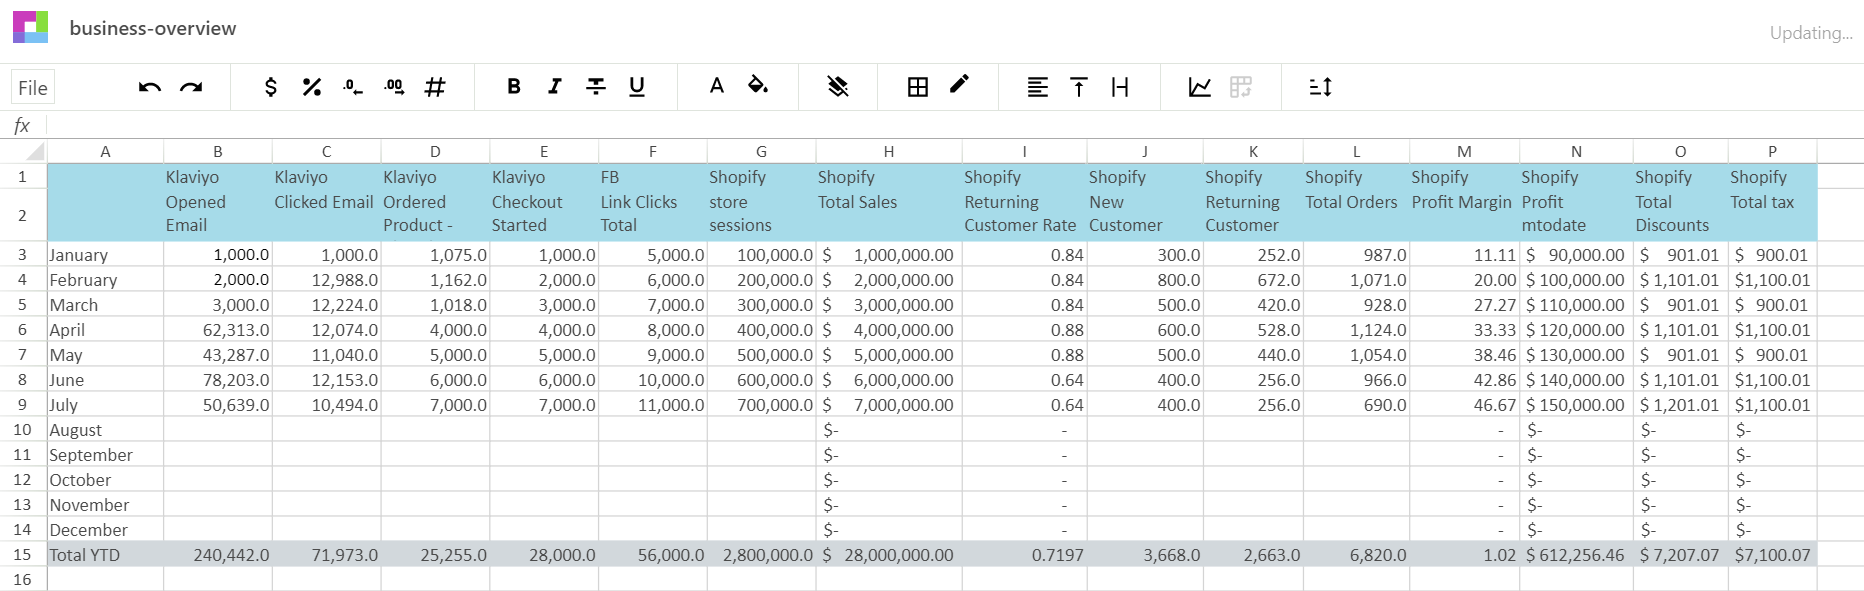
Sales: This is the most important metric to track, as it will show you how your business is performing. You should track both total sales and sales by product or category. Usually, this would be from Shopify or your website.
Expenses (Ad Spend): It's also important to track your expenses so that you can see where your money is going and identify any areas where you can cut costs. Usually, this includes money spent on ads from applications like Instagram ads, google ads, and Facebook ads.
Traffic: You should track both your overall website traffic and traffic to your product pages. This will give you an idea of how well your marketing efforts are working and whether or not people are interested in your products. This will commonly be from Google Analytics or Shopify.
Conversion rate: This metric will show you how many visitors to your site make a purchase. A high conversion rate is indicative of a successful e-commerce business. This will come from the same place as your traffic measurements such as Google Analytics or Shopify.
Average order value: This metric will show you how much people are spending on average when they purchase from your store. A higher average order value is generally better, as it means that people are buying more expensive items from your store. This metric will come from your store such as Shopify.
Of course, you can also track other metrics that are specific to your business and industry if you are not an e-commerce business. Some other types of data that can be included in a reporting dashboard are:
- Financial data
- Stock Price over time
- Profit and Loss Statements
- Rate of Return
- Cost of Goods
- Sales data
- Traffic data
- Social media data
- Customer data
- New Customers
- Repeat Customers
- Average Customer Review
- Product data
- Features per Month
- Downloads per Day
- Employee data
- Inventory data
- Inventory on hand
Including different types of data in your reporting dashboard will allow you to get a complete picture of your company's performance. The important thing is to choose metrics that will give you insights into how your business is performing and where you need to make improvements. Once you have collected all the data you need, it's time to start creating your dashboard!

Setting up your dashboard using Sourcetable
There are many ways to create dashboards using Sourcetable. The first, and easiest way is to follow the steps below:
- Connect your data with Sourcetable's 30+ integrations
- Decide on your goals: Sales, Marketing, or Business Overview
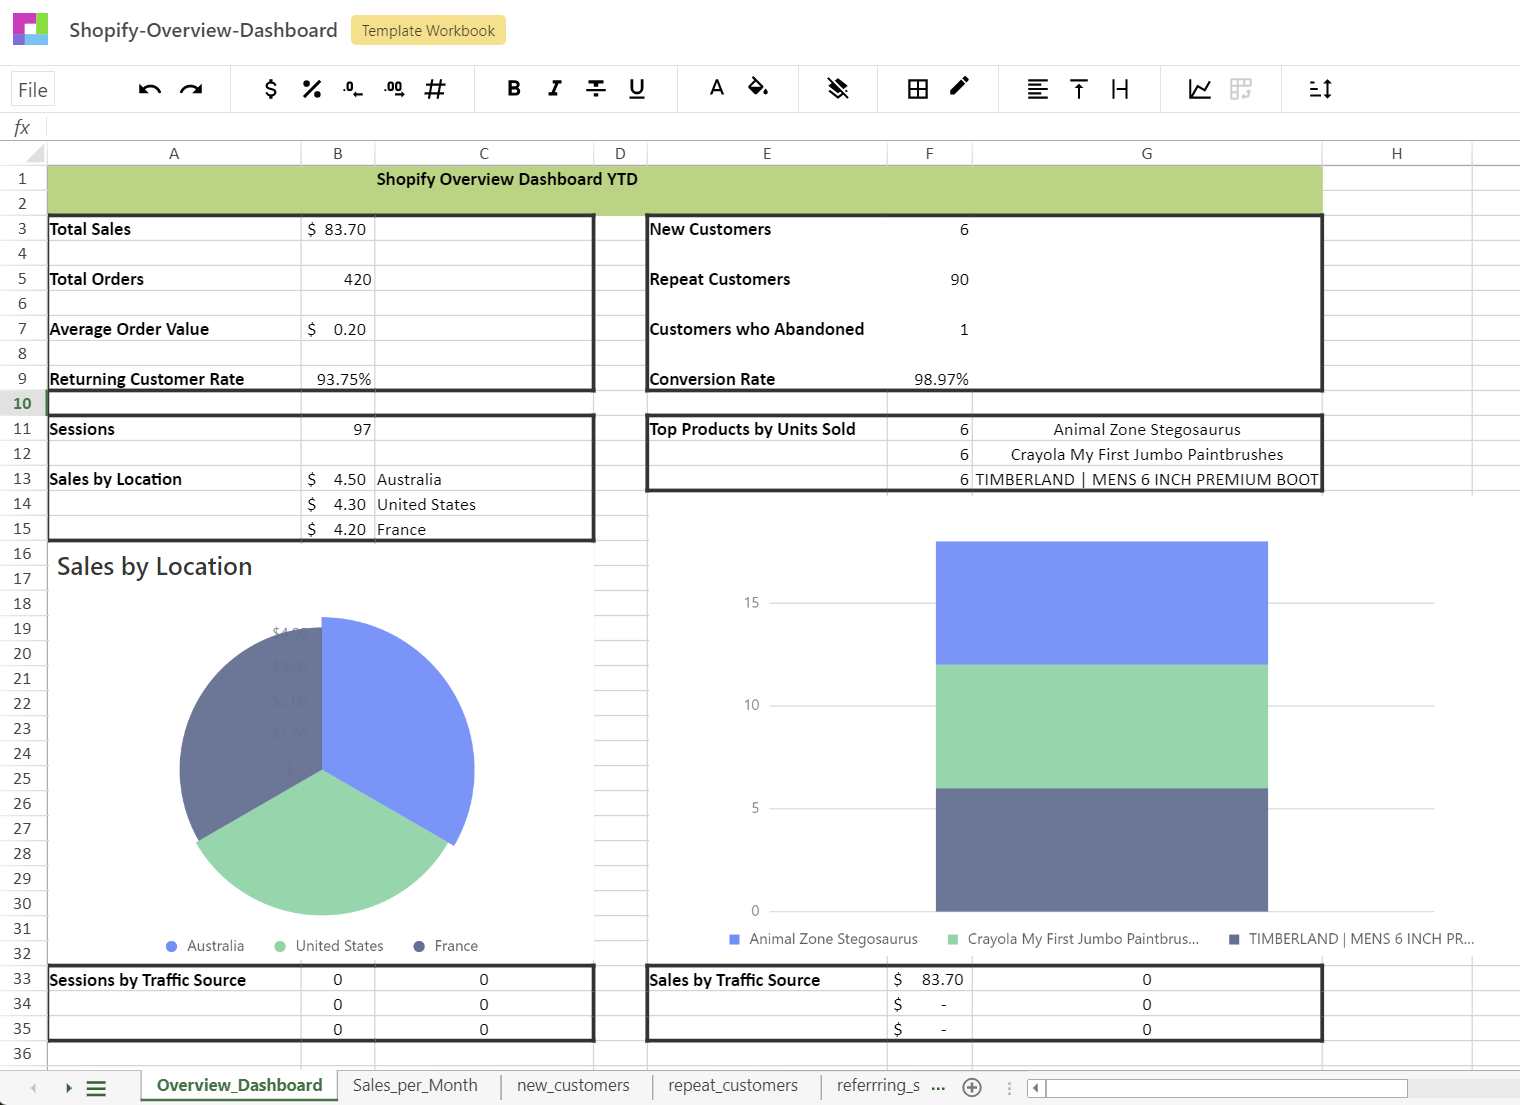
- Browse pre-prepared dashboard templates
- Choose a dashboard template to use with your own data
- Start Tracking and see your data flow
With Sourcetable you can create a dashboard from scratch, or you can start by using a dashboard that we have pre-prepared for you. Your live data will be used for either and all dashboard templates are fully customizable as long as you have used Excel or Google Sheets. Though there are many different ways to create a reporting dashboard, only one allows you to connect all of your data in one live dashboard.
Creating a reporting dashboard can seem daunting, but it doesn't have to be!
Conclusion
If you're not using a reporting dashboard, now is the time to start! Creating a dashboard can seem daunting, but there are many easy-to-use tools available that can help. Sourcetable is one such tool that can help you get started quickly and easily. So what are you waiting for? Start tracking your company's performance today!