
Aggregating your data to find: AVG, COUNT, MIN, MAX, SUM

Data analysis with spreadsheets relies on combining, changing, and investigating data to find useful information that can be used to make decisions. Aggregates are an important tool in your arsenal like structured referencing, or joins. Aggregates allow you to easily add together(SUM), count the total number(COUNT), average the number(AVG), find the minimum value(MIN), and find the maximum value(MAX) of your data points.
What is an aggregate?
An aggregate in Sourcetable is the calculation/manipulation of your data in a way that you choose in order to summarize or glean insights. They are great for a first pass at your data.
Using Aggregates
Sales data is great data for demonstrating the uses of aggregates. They allow you to average data, add data together, find the minimum, find the maximum, and even count the data points. Once your integrations have finished syncing you will be able to access your data in a workbook by clicking on Source in the sidebar.

After choosing the source for the data, Sourcetable will show all of the tables associated with that integration allowing you to choose which table you would like.

For ease of use, the orders table was used. Once you have selected the table you will be able to create and select aggregates in the aggregates area.

There is already a Groupby for time in the Sales-Orders data table for order.processed_at by month. Time grouping is useful for analysis because it allows the changes in trends, whether positive or negative, to be more obvious. Using the sales data you can calculate the following with the aggregates on Sourcetable:
AVG

AVG takes the average total_price in the Sales-Orders data table.
- Click into Aggregates then click +Add Aggregate
- Select
order.total_pricefor the column - Select
AVGfor the calculation type - Click Update Table
- See your results on the left-side
COUNT

COUNT, Counts the number of order ids in the Sales-Order data table.
- Click into Aggregates then click +Add Aggregate
- Select
order.total_pricefor the column - Select
COUNTfor the calculation type - Click Update Table
- See your results on the left-side
MIN
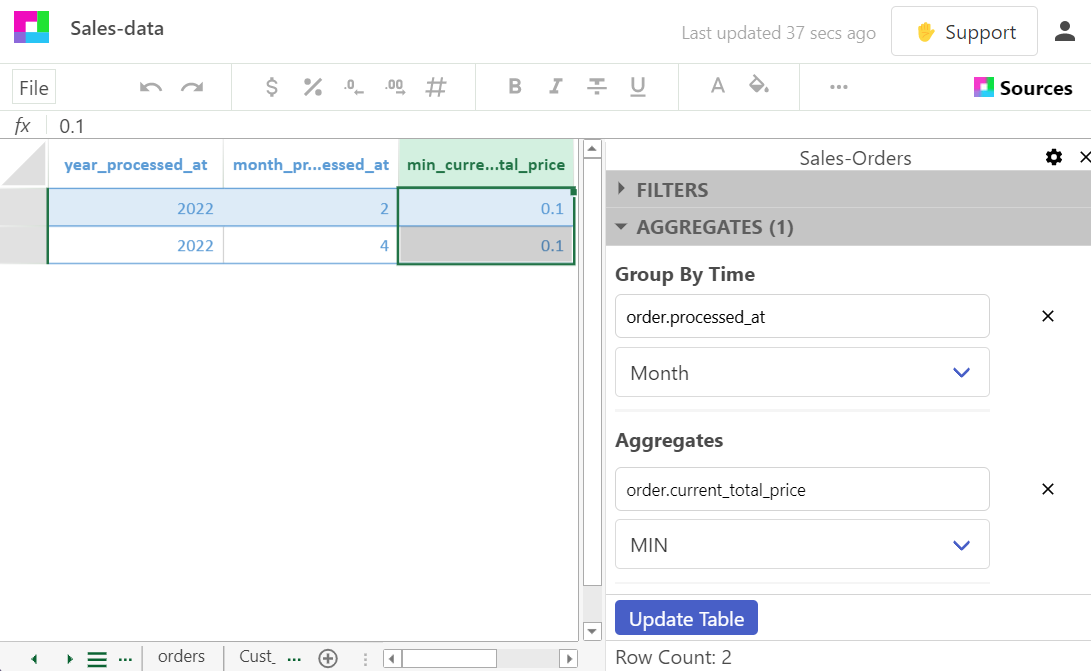
MIN, Finds the minimum total_price in the Sales-Orders data table.
- Click into Aggregates then click +Add Aggregate
- Select
order.total_pricefor the column - Select
MINfor the calculation type - Click Update Table
- See your results on the left-side
MAX

MAX, Finds the maximum total_price in the Sales-Orders data table.
- Click into Aggregates then click +Add Aggregate
- Select
order.total_pricefor the column - Select
MAXfor the calculation type - Click Update Table
- See your results on the left-side
SUM

SUM, Adds all fo the total_price data in the column of the Sales-Orders data table.
- Click into Aggregates then click +Add Aggregate
- Select
order.total_pricefor the column - Select
SUMfor the calculation type - Click Update Table
- See your results on the left-side
Total Sales Revenue by Country using Aggregates
Aggregates can also be used with any column in the data table. Here we will sum the total_price from the Sales-Orders data table and show the sum per country. This type of analysis would be helpful for an e-commerce business that wants to know what geographic areas are creating the most revenue.
Using SUM and selecting the billing_address_country column adds up all of the total_price data in the column for each distinct billing_address_country of the Sales-Orders data table.
- Click into Aggregates then click +Add Aggregate
- Select
order.total_pricefor the column - Select
SUMfor the calculation type - Select
billing_address_countryfor the column under columns - Click Update Table
- See your results on the left-side

The total_price sum can be broken down by selecting any column in the Sales-Order data table. Play around with your own data to see what insights you can find.
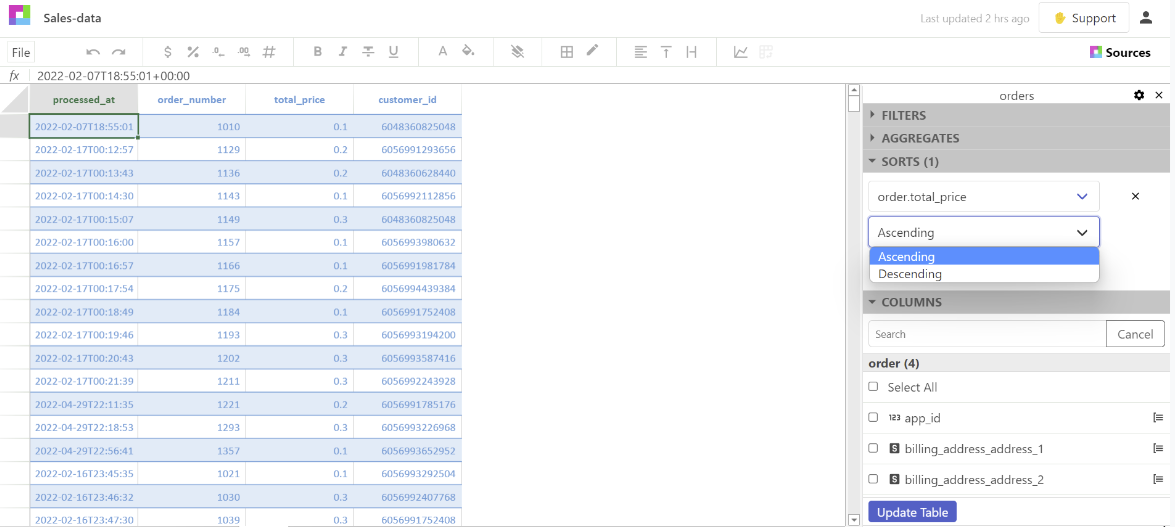
Sorting Aggregates
Now that the data has been manipulated it might not be in the order you would like. Maybe you would like to see the month with the smallest average order first. All you need to do is open the sort area and choose the column to sort on and whether you want to sort ascending or descending.
Conclusion
Aggregates are a great way to manipulate data in Sourcetable. They can help get your analysis done faster and easier. Not only can you create aggregates from data tables, but you can also create them from multiple data sources all at once. This article should have given you a basic idea of how to use aggregates. There’s a lot more they can do but these are the main functions to get you started. So next time you need to manipulate some data Sourcetable aggregates will be there for you!
Stay tuned for a future blog post with more complex uses for Aggregates