
Running a business can be stressful and managing costs even more so. One way to help understand your business is to have a report with the top products, product SKUs, and product names, per month. Sourcetable’s online spreadsheets are a great way to easily create a report using two methods:
- Pre-made reporting templates
- Using formulas and formatting in a spreadsheet
Both methods are simple and easy to use. All you need to do is connect your store data either with Shopify or another data integration and follow the steps in the article below.
Using Templates
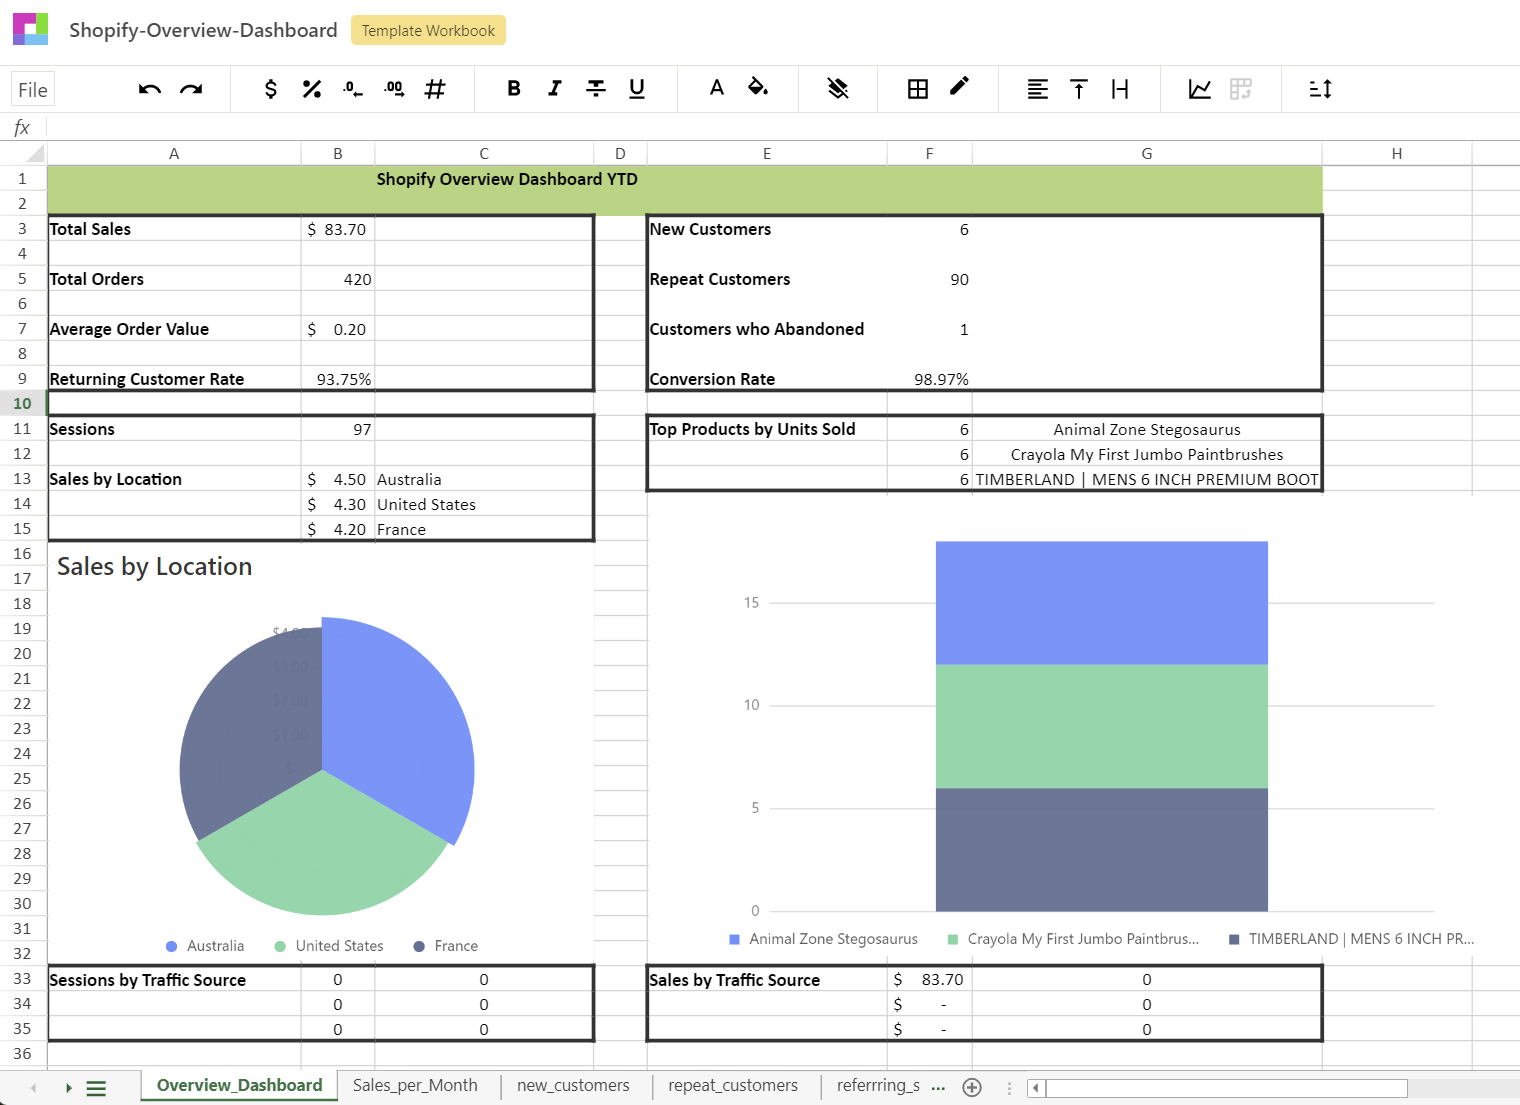
All Sourcetable users can access our library of pre-made reports. We call these "Templates", and they're the easiest way to create a report if you're just getting started or need an overview of your business. To make use of Sourcetable's Shopify Templates, all you need to do is connect your Shopify store and select the Shopify Overview Template.

Once you click "Use Template", the app will automatically create a report using your own Shopify data. The data is synced live, so your Shopify report will always be up to date.
Sourcetable is fully customizable. Once created, you can change any part of the report you like.
Using Formulas and Formatting in a Spreadsheet
Creating reports from scratch is a little more work. First, connect your Shopify store to Sourcetable. If you have other data sources that you want to connect, like SaaS apps or databases, you can connect those as well to include them in your report.
Next, create a data table that has the following columns:
skutitlecount_sku- which can be made using aggregates
Then you will want to sort the column count_sku descending that way you have a list with the largest value at the top.

Once you have the data table made you can either view your report in this format or you can make it prettier by going back to Sheet1 and creating some nicer formatting and get the data using the formula =QUERY("data_table_name#0","column_name",0) the #0 is for the row number that you want to display the data for, which starts at zero.
In my report I used the following formula for displaying the top skus =QUERY("top_sku#0","sku",0. For product names I used =QUERY("top_sku#0","title",0). And for the top sku count I used =QUERY("top_sku#0","count_sku",0) then you change the row that you want to display. You can have a top 3, top 5, top 10 or whatever number you would like to show. To get your top three SKUs your formulas would be:
=QUERY("top_sku#0","sku",0
=QUERY("top_sku#1","sku",0)
=QUERY("top_sku#2","sku",0)
You can see the final product below:

Conclusion
Creating a report for your company's top products with SKUs and product names is easy with Sourcetable. All you need is your company's data, either from Shopify or another source, and the Sourcetable pre-made reporting templates or a spreadsheet. It's as simple as integrating your data, and clicking the templates for the reports you need. Your data is then shown in the report of your choice, in this case it is the Top Products Report in the Shopify Overview Template