

Luv Aj started as the after-school hobby of the CEO and designer, Amanda Thomas. The business grew after a chance meeting with a buyer from Fred Segal who wanted to buy the entire collection when she was only 14. The quality and on-trend designs made the business a success. Amanda Thomas went from hand making and designing all of the jewelry to leading a brand that has been featured in magazines and seen on celebrities across the country.
With success came an ever-growing list of apps and websites to consult about the health of the company. The leaders at Luv Aj were wasting time every month compiling and disseminating their reports to the team. Figuring out what app had which data was becoming a chore. Sourcetable was there to help assemble their data into live cross-platform KPI dashboards.
“This [dashboard] is so quick and at the ready, and just already populated.”
Scattered Data Challenges
The growing e-commerce jewelry business was wasting time each week downloading, compiling, and dispersing reports to their staff. The large number of apps that were necessary to view their ad and sales analytics was frustrating many in the company. An in-depth analysis of sales and product order data was difficult to obtain. Luv Aj wanted to have all of its analytics and reports in one place without sacrificing complex analysis and granular details.
“I usually just hop into Sourcetable at the end of the month, and just do a quick refresh and then we chat about it internally with our team.”

Why Sourcetable?
Having a centralized place to view all of their data and reports was key for Luv Aj. With over 40 integrations to third-party applications and databases, Sourcetable was the right solution. The staff didn’t want to have to compile and download reports from each service to send to the team anymore. Sourcetable was able to provide a custom dashboard with all of their sales and ad KPIs from their live data across multiple platforms that anyone on the team can access.
“Integrations with multiple platforms, I think that definitely is really great!”
Process and Actions
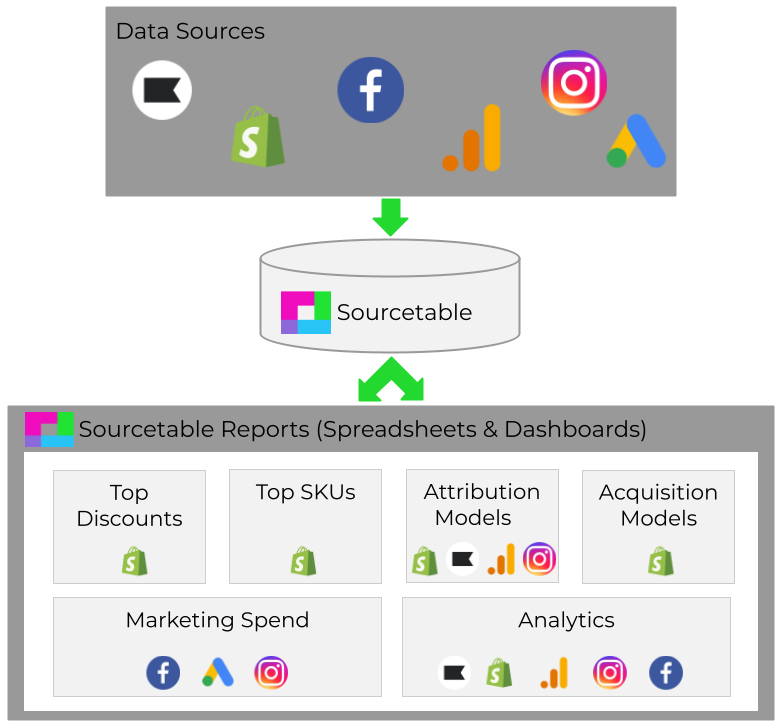
A custom dashboard was created in Sourcetable allowing Luv Aj to see their monthly KPIs quickly whenever they want. They can quickly glance at the dashboard before a meeting with the company for faster decision-making. They have a main dashboard with cross-platform data on all marketing for their business from Instagram ads, and Facebook ads to Shopify orders and Klaviyo email campaigns. As well as, more granular reporting on attribution models, acquisition sessions, top discounts, and even top-selling SKUs.
“ It's just about streamlining analytics. So. if we can have analytics from multiple platforms in one place, that just saves us tons of time and energy.”

Results
Luv Aj is saving time and energy by connecting its marketing, ad, and performance data into a unified spreadsheet dashboard that is always up to date. No more data entry or searching for the specific SaaS app with the data they need. Now their spreadsheet dashboard updates automatically from all of their connected data sources. Any team member with a Sourcetable login can see an overview of how the company is performing. Company leaders have the information they need to make design decisions and communicate more effectively with their teams. As Amanda de los Reyes said, “I translate a lot of this stuff into visual information like if I'm putting together a newsletter, and I want to see okay, what is everybody buying this month? I'm gonna feature that product as the top hero image.” The top-selling product information wouldn’t be available without the Sourcetable dashboard.