
The spreadsheet software industry has a comfortable arrangement with mediocrity. It's been largely unchallenged for thirty years, and the arrival of AI gave it a new set of marketing slogans without fundamentally changing what the products could do. You can now ask Excel to help you write a VLOOKUP. Google Sheets will suggest a formula. Microsoft Copilot will autocomplete your pivot table.
What none of them will do — reliably, verifiably, in a way that someone can actually check — is go get your data, run your model, parse your PDF, connect to your database, and hand back a finished spreadsheet. That's the actual job. And that's what benchmarks are supposed to measure.
Over the past several months, we ran Sourcetable against every credible public benchmark we could find. Then we built one ourselves when the existing ones turned out to be broken. Here's what happened.
Benchmark One: The Finance Test Nobody Was Supposed to Ace
The Vals.ai Finance Agent benchmark was developed with Stanford researchers, a Global Systemically Important Bank, and industry experts. It is not a trivia quiz. It is 50 questions written by people who do this work for a living, covering the kinds of things a financial analyst actually gets asked on a Monday morning:
How many basis points did Micron beat or miss its Q3 2024 GAAP gross margin guidance?
What was the total consideration TKO paid to acquire Endeavor assets measured at transaction close?
As of March 10, 2025, what is the face value of Salesforce's debt excluding their sustainability notes?
By how much did AMD beat or miss its non-GAAP gross profit guide in each of the last four quarters, and what was the average beat or miss in percentage terms?
These are not gotcha questions. They're the kind of thing a first-year analyst gets wrong because they pulled the number from the wrong filing, or used the GAAP figure when the question asked for non-GAAP, or missed the footnote where management quietly restated the guidance range. They require reading the actual documents — 10-Ks, 10-Qs, earnings call transcripts, press releases — not just having strong priors about what a number might be.
The top general-purpose AI models score in the mid-60s. Claude Opus 4.5 scores 67%. That's not a knock on those models — it's a reflection of what happens when you ask a language model that doesn't have direct access to financial data infrastructure to do institutional-grade financial research.
Sourcetable scored 100%.
Fifty questions. Fifty correct answers. The platform has direct access to 500+ financial data APIs — SEC filings, earnings call transcripts, real-time market data, analyst estimates, guidance histories — and the AI knows how to use them. When the question asks about non-GAAP gross margin guidance versus actuals over four quarters, the system pulls the earnings releases, finds the guidance, finds the actuals, computes the delta, formats the output. It doesn't guess. It reads the document.
The 33-point gap between Sourcetable and the best standalone AI model isn't a gap in reasoning quality. It's a gap in data infrastructure. A model without access to live financial data is doing financial research the way you'd do it if you had no internet connection and a slightly spotty memory — impressive, given the constraint, but not the same thing.
Benchmark Two: Rows.com's Spreadsheet Test
Rows.com — itself an AI spreadsheet company — published a benchmark of 53 spreadsheet tasks. Formulas, data transforms, analysis, model creation, arithmetic. The kind of work a data analyst actually does in a spreadsheet all day.
Their benchmark was well-constructed: clear prompts, specific expected outputs, real spreadsheet operations. We ran Sourcetable against all 53 tests.
Sourcetable scored 100%.
For context: ChatGPT Advanced Data Analysis scored 72%. Excel Copilot scored 68%. Google Sheets with Gemini scored 64%.
A few observations on what the gap means. The tests where competitors underperformed cluster around the same pattern we see in every benchmark: tasks that require the AI to actually do something rather than suggest something. Competitors can describe the formula you need. Sourcetable writes it, applies it, checks it, and moves on. The architecture is the difference — not the underlying model, not the prompt, not the amount of money spent on training data. An AI that can only suggest is not the same product as an AI that can execute.
The Rows benchmark also has a category worth flagging: six of the 53 tests are what we call "dynamic" — questions where the correct answer depends on real-world data that isn't in the spreadsheet (country capitals, currency exchange rates, ISO codes). We passed those too, but we exclude them from the static-answer scoring because they test something different: live knowledge retrieval rather than spreadsheet manipulation. 53/53 on the full set. 47/47 on the static-only subset. Either way: perfect.
The Benchmark That Made Us Build Our Own
Before we ran the tests above, we tried to run a third one: SpreadsheetBench, a community-maintained benchmark of 200 spreadsheet tasks. We imported the dataset, set up the evaluation harness, and started hitting walls.
Not AI failures. Infrastructure failures. The test suite itself was broken.
Here's what we documented:
Corrupted XLSX files. Three input files for test case 74-47 were physically unreadable. Not wrong — corrupt. Any platform running them fails for reasons that have nothing to do with AI capability.
Wrong filenames. Test 102-20's input file was named 1_101-20_input.xlsx — a typo that causes any automated evaluation to fail silently or crash before it even starts.
Missing reference files. Tests 43026, 46444, 4714, and 52964 were missing their answer files for multiple variants. You cannot evaluate what you cannot compare against.
Whitespace mismatches. Test 536-37 expects the string " TO, VR" — with a leading space — while the only defensible correct output is "TO, VR". Test 44389 expects "MMX,POK" (no space after comma) where any reasonable system outputs "MMX, POK". These aren't edge cases. They're the test being wrong.
Floating-point artifacts as ground truth. Test CF_6540 expects 41.144999999999996 as an exact match. That's not a value. That's a floating-point representation artifact from how Python stores decimals internally. No AI should be expected to reproduce a floating-point rounding error to 15 decimal places.
Ambiguous prompts with contradictory answers. Test 99-24 defines the expected response range as NotPaid!A1:D7, Paid!A1:D43 in the prompt, but the reference answer file has data in NotPaid!A1:D12, Paid!A1:D58. Both can be correct depending on how you interpret the instructions.
We documented every issue, fixed what could be fixed, and reached the same conclusion every time: when a test can fail for reasons unrelated to the capability being tested, the score doesn't mean anything. SpreadsheetBench isn't a bad idea — a community-maintained, open benchmark for spreadsheet AI is exactly what the industry needs. But this version had enough structural problems that we couldn't use it as a credible measure of anything.
So we built our own.
Benchmark Three: The One We Made
The Sourcetable Benchmark started from one design constraint: every test pass or fail should be attributable to the AI's actual capability, not to ambiguity in the prompt, inconsistency in the reference data, or an evaluation script that can't handle a leading space.
Four principles:
XLSX-In-Out. Every test starts with a real XLSX file and ends with one. Import a spreadsheet, do a thing, export a spreadsheet. Compare mechanically. No vague "show me a chart" prompts where a dozen outputs could all be valid.
One True Answer. Every prompt specifies exactly one possible correct output — exact cell locations, exact column ordering, exact number formats. We even escape date separators (mm\/dd\/yyyy) in the prompts to eliminate localization as a variable. If the test can produce two valid answers, it doesn't go in the benchmark.
Capability Focus. Each test fails for exactly one reason: the AI doesn't have the specific capability being tested. Prompts provide everything else — data location, output format, sheet names — so that a failure on a connectors test is actually about connectors, not about whether the AI guessed the right sheet name.
Mechanical Evaluation. We use IronCalc as the comparison engine. It checks sheet names, bounding boxes, cell types, background colors, font styles (bold/italic/underline), whether formulas exist where formulas are required, numeric values within epsilon=0.001, and formatted display values. A human never makes a judgment call.
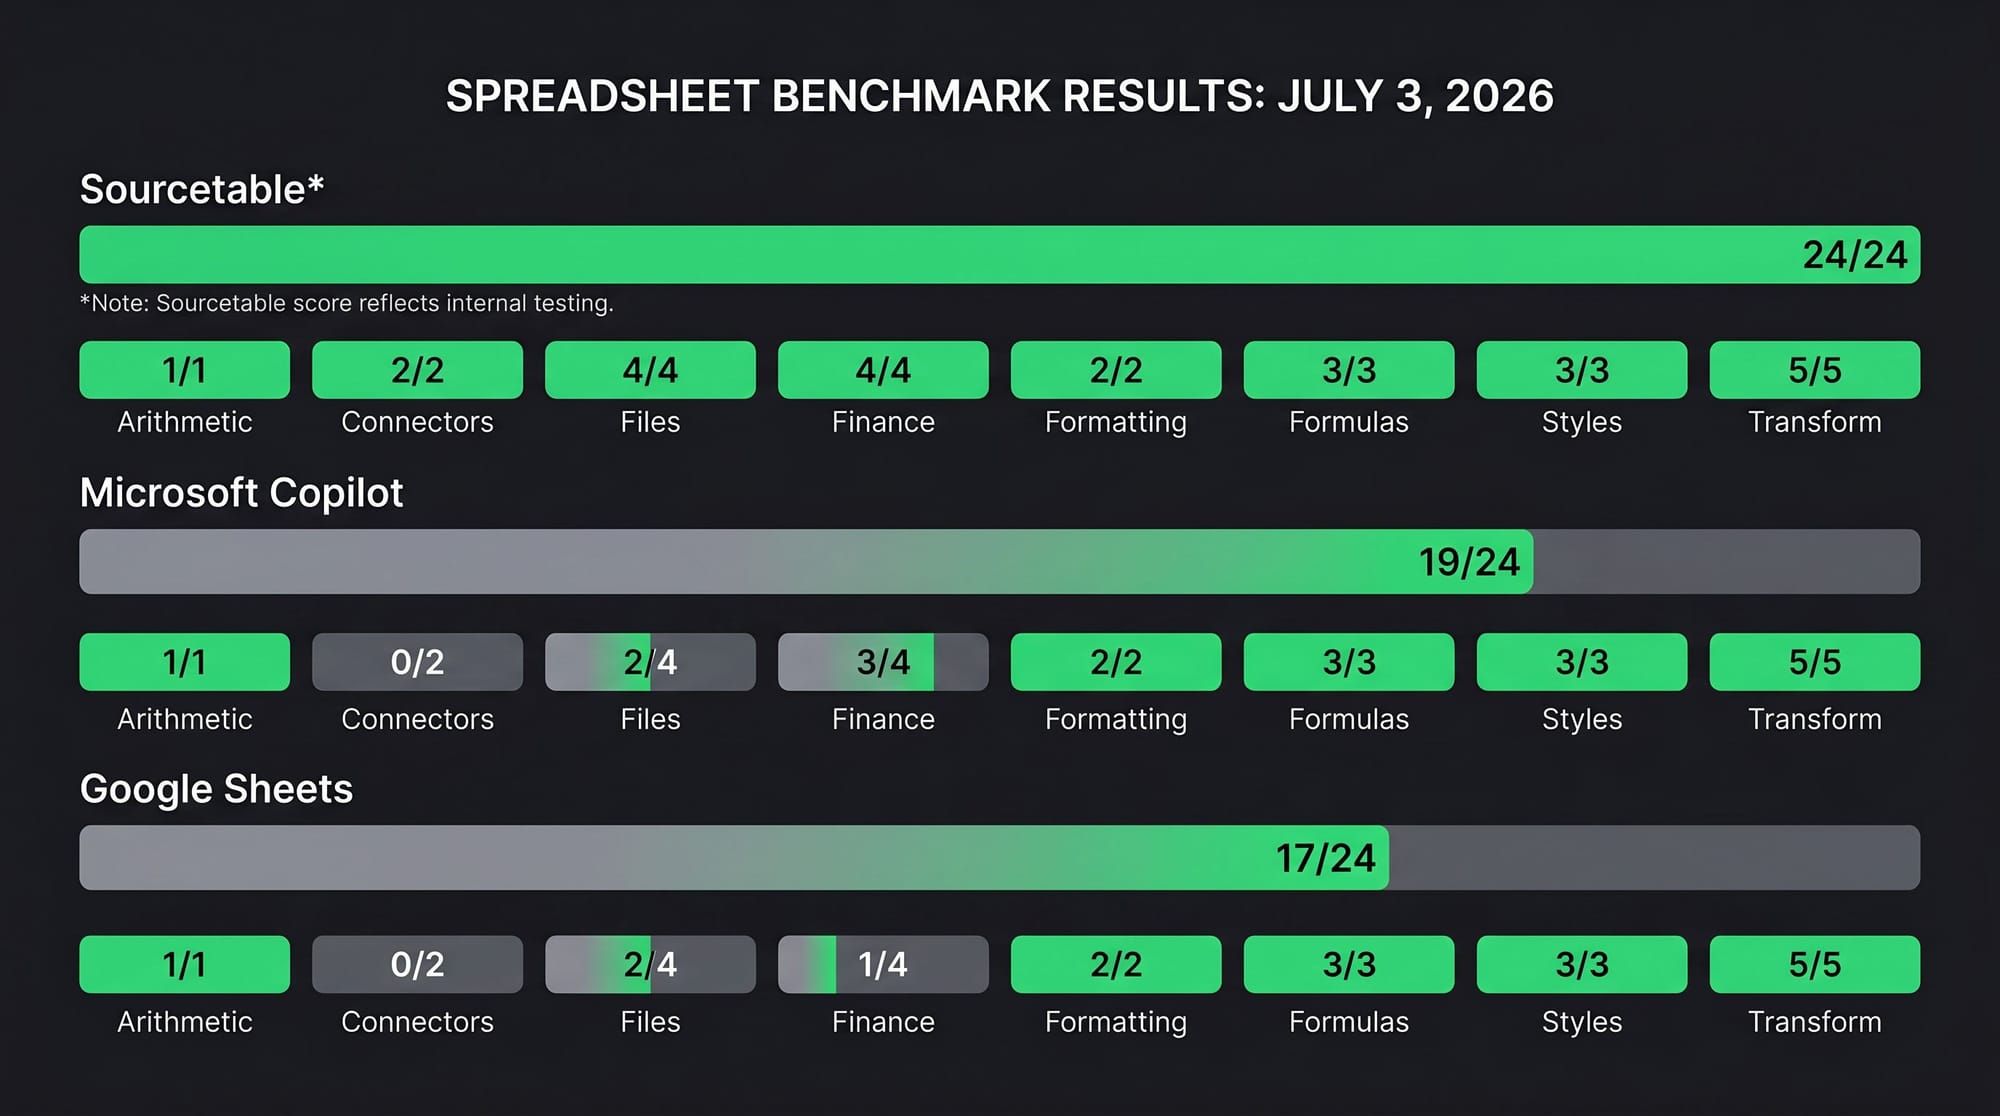
We ran 24 tests across eight categories. The scoreboard:
| Platform | All | Arithmetic | Connectors | Files | Finance | Formatting | Formulas | Styles | Transform |
|---|---|---|---|---|---|---|---|---|---|
| Sourcetable | 24/24 | 1/1 | 2/2 | 4/4 | 4/4 | 2/2 | 3/3 | 3/3 | 5/5 |
| Microsoft Copilot | 19/24 | 1/1 | 0/2 | 2/4 | 3/4 | 2/2 | 3/3 | 3/3 | 5/5 |
| Google Sheets | 17/24 | 1/1 | 0/2 | 2/4 | 1/4 | 2/2 | 3/3 | 3/3 | 5/5 |
Sourcetable ran in Light mode — the platform's most conservative AI setting.
The totals are interesting. The zeros are the story.
Connectors: both competitors 0/2. The two tests ask an AI to connect to a live ClickHouse database at a public endpoint and import 100,000 rows with specific formatting, and to connect to a Northwind sample database and import a products table with exact column-type mappings. Both Microsoft Copilot and Google Sheets scored zero. Not "struggled." Not "partial credit." Zero — because neither product can establish a live database connection from its AI layer and bring the data back into the spreadsheet. They can suggest the SQL. They cannot run it.
Files: both competitors 2/4. The easy half — parsing an attached PDF and an attached DOCX — both competitors passed. The hard half — downloading a text file and a CSV from public URLs — both competitors failed or abstained (the prompts include an honest escape clause: "do nothing if you cannot download files from the Internet"). Sourcetable executed the HTTP requests, retrieved the files, and imported them correctly.
Finance: Google Sheets 1/4, Copilot 3/4. The gap between Google and Microsoft here reflects what the Rows benchmark also showed: Google's AI mode has no web search capability. It's operating entirely on training data for live financial questions. That's fine for historical data within the training window; it's a hard constraint for current prices, current board compositions, current earnings guidance. The one Google Sheets passed was likely within its training data. The three it missed required retrieval.
Everything else: tied. Formulas, styles, transforms, formatting, arithmetic — all three platforms scored perfectly across the board. These are the categories that traditional spreadsheet AI has invested in for years. The parity is real. Nobody is faking formula generation or cell formatting.
The pattern across all three sections of the benchmark: the gap is entirely in the categories that require the AI to operate outside the spreadsheet. Inside the grid — formulas, formatting, sorting, cleaning — the platforms are remarkably close. The moment you need the AI to reach outside and bring something back, the architecture determines everything.
What Three Perfect Scores Actually Mean
We're not a disinterested party. We wrote the Sourcetable Benchmark. We ran all three platforms ourselves. We chose which tests to include. Read these results accordingly.
What we can say: the Vals.ai benchmark was built by Stanford researchers and finance industry professionals, not us. The Rows.com benchmark was built by a competitor, not us. The methodology for both is public. Our own benchmark's test files, evaluation code, and full results for all three platforms are published on GitHub — anyone can run it, anyone can submit results, anyone can argue that a specific test is unfair.
The 100% on Vals.ai is the number we're proudest of, because it's the hardest to fake. Those aren't formatting tests or sort-by-column tasks. They're questions like: What would be the impact to net income in dollars and percent if all of Boeing's 2024 debt were refinanced at 3% higher interest rates than current? That requires finding Boeing's full debt schedule in the 10-K, reading each instrument's current rate, calculating the incremental interest expense, tax-effecting it, and expressing the answer two ways. A system that doesn't have access to SEC filings and can't execute code to do the math will either hallucinate or give up. A 33-point gap between Sourcetable and the best standalone language model is what financial data infrastructure looks like when it's actually wired in.
The 0/2 on connectors for both Microsoft and Google is the most clarifying number on our own benchmark, because it's the hardest to argue with. The test endpoints are public. Anyone can verify that the ClickHouse playground at play.clickhouse.com exists and is queryable. If Copilot or Google Sheets can connect to it and import 100,000 rows with the specified formatting, we'd love to see the result — the pull request is open.
The Actual State of AI Spreadsheets in 2026
Here's an honest summary of where things stand.
Microsoft Copilot and Google Sheets are genuinely good at what traditional spreadsheet software is good at, with AI acceleration. Formula suggestion, data cleaning, pivot tables, basic analysis. For users who live inside a spreadsheet full of data they already have, both products are real and useful. Their scores in formulas, styles, transforms, and formatting are perfect on every benchmark we ran. That's not faint praise.
What they're not is architecturally capable of operating outside the spreadsheet. No live database connections. No code execution. No file downloads. No real-time data retrieval. This isn't a quality gap or a prompt engineering gap — it's a structural decision those products made about what they are. They are AI layers on top of existing spreadsheet software. The spreadsheet is still the boundary.
Sourcetable was built as something else: a platform where the AI has tools, and the tools include a Python runtime, a SQL executor, HTTP access, 500+ financial data connectors, database integrations for Postgres and MySQL and ClickHouse and 100 other services, and the ability to train and run actual models. When the benchmark asks the AI to train a Support Vector Regression model on the data in sheet train and predict values in sheet predict — a test both competitors pass on (with the "do nothing if you can't" escape clause absorbing their abstentions) — Sourcetable runs the code.
The question for any user of these tools is simple: what do you actually need to do? If the work lives inside a spreadsheet you already have, the gap between platforms is smaller than the marketing suggests. If the work requires going outside — and increasingly, real analytical work does — the gap is the entire product.
A Note on Benchmark Design
One thing building this benchmark taught us: rigorous measurement is harder than it looks, and the industry has been getting away with not doing it for a long time. The SpreadsheetBench issues aren't a criticism of the people who built it — community benchmarks are hard to maintain, and garbage-in-garbage-out is a universal problem in dataset curation. The issues we found are the same issues that accumulate in any manually assembled dataset over time.
What's notable is that the major vendors — Microsoft, Google, and everyone else — have had no particular incentive to demand better. When there's no reliable external scorecard, you can launch an AI feature, run your own internal evals, and publish a case study about how an enterprise customer saved three hours a week. Nobody can check you.
We built a benchmark with a mechanical evaluator and public test files specifically because we want to be checked. If the Sourcetable Benchmark has a test that violates our own stated design principles — ambiguous prompt, multiple valid answers, evaluation criterion that's actually testing the wrong thing — we want to know. Open an issue. We'll fix it.
If our scores are wrong, the evaluation script will tell you. It doesn't have an opinion about who wins.
The Sourcetable Benchmark is public at github.com/sourcetable/benchmark. All test files, the evaluation script, and results for all three platforms are available. Submissions via pull request.
Andrew Grosser is the CTO and co-founder of Sourcetable.
