
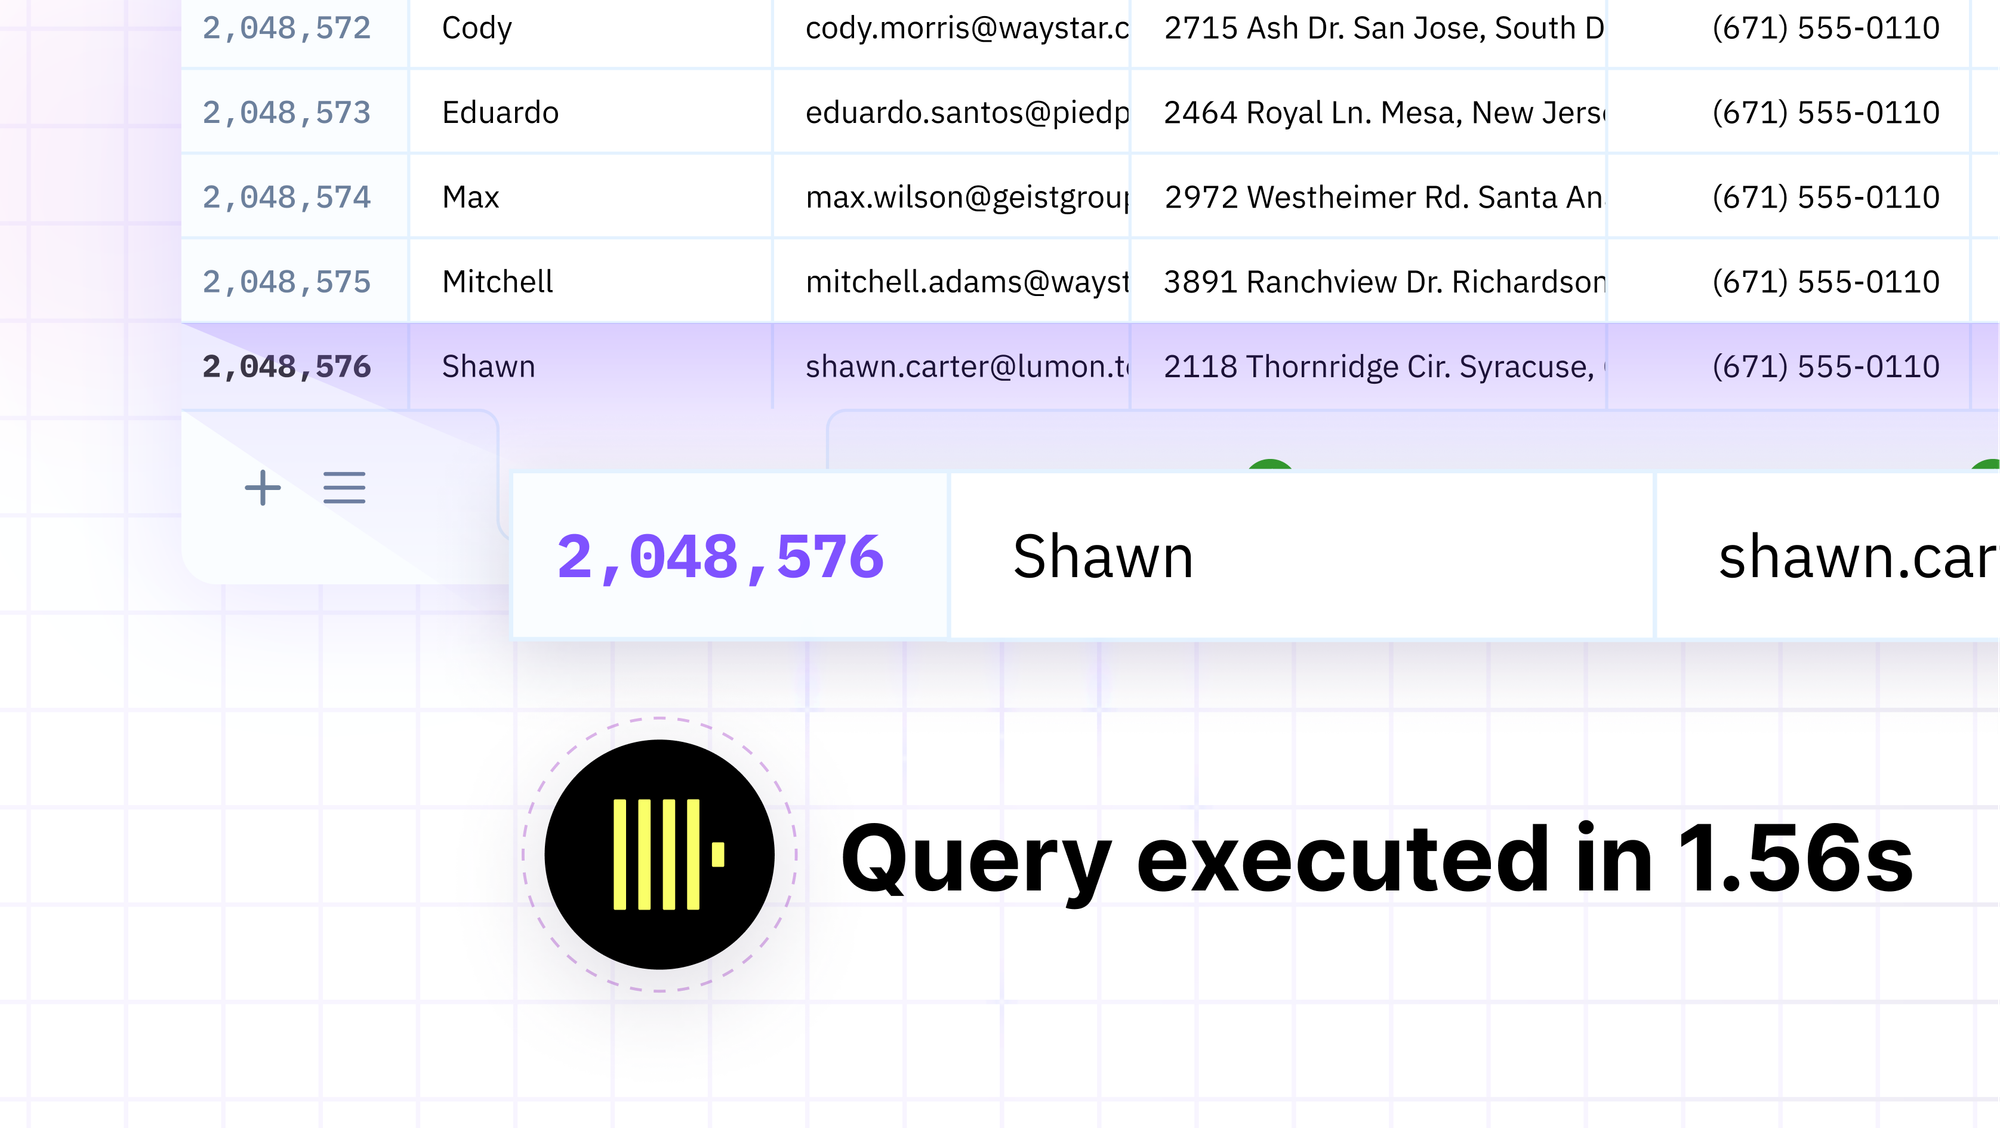
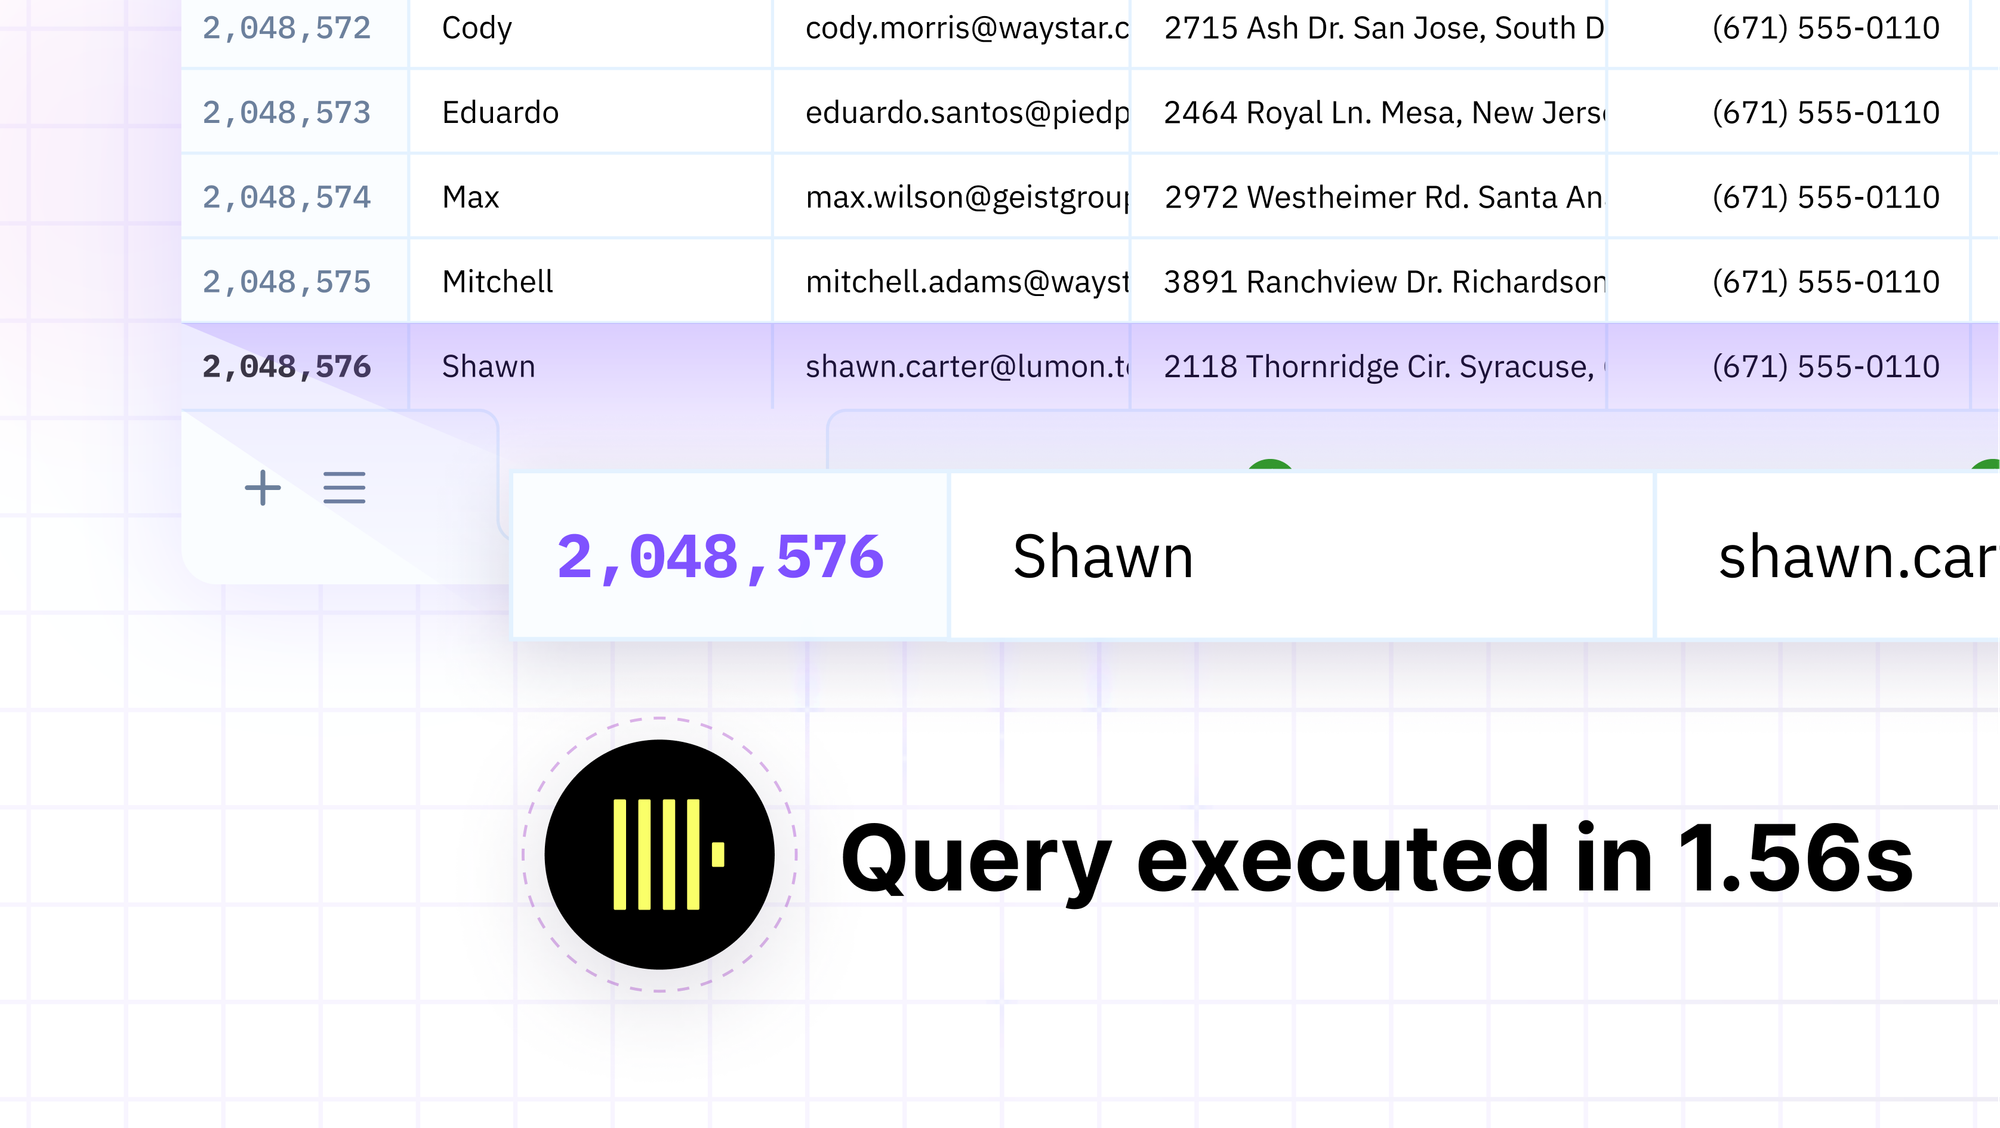
If you've ever had to analyze trillions of rows of data then you have probably heard of ClickHouse. An OLAP DBMS solution that combines a large database with fast querying, ClickHouse is the holy grail for data analytics and reporting.
We're big fans, obviously. Sourcetable's engineering team uses ClickHouse to handle all of our user events tracking and as the analytical workhorse for our automated performance marketing agents.
One advantage of being avid ClickHouse users is that we dogfood it constantly inside our product, so today we're thrilled to announce that the ClickHouse connector is now available to all Sourcetable users.
Our engineers prefer querying ClickHouse directly through our SQL editor, whereas the growth team prefers a less technical PowerBI-style GUI approach or to use the AI chat directly – especially handy in data exploration contexts for those of us who don't know the schema well and are looking for insights buried across thousands of rows and hundreds of tables.
One reason this works well is because Sourcetable's Excel-style spreadsheet product has a SQL engine under the hood. All queries – including AI queries – have associated metadata, so everyone can audit SQL, agree on the source of truth, and trust reporting outputs. This allows non-technical team members to use the same reporting system as those more technically blessed. At last: Finance, growth, engineering and marketing can all use the same system.
It may seem obscenely overkill to inject ClickHouse into a spreadsheet. So overkill, in fact, that we had assumed users wouldn't need this and had delayed the release. Internally, however, we have found it to be so useful to build Excel-style reports on top of ClickHouse outputs that we have decided to release it anyway.
Here is some of what you can do with Sourcetable's Clickhouse connector:
- Natural language → SQL
- Natural language → Python, operating directly on your data
- Add a credential from the chat or from the connectors page — both paths fully sync your schema
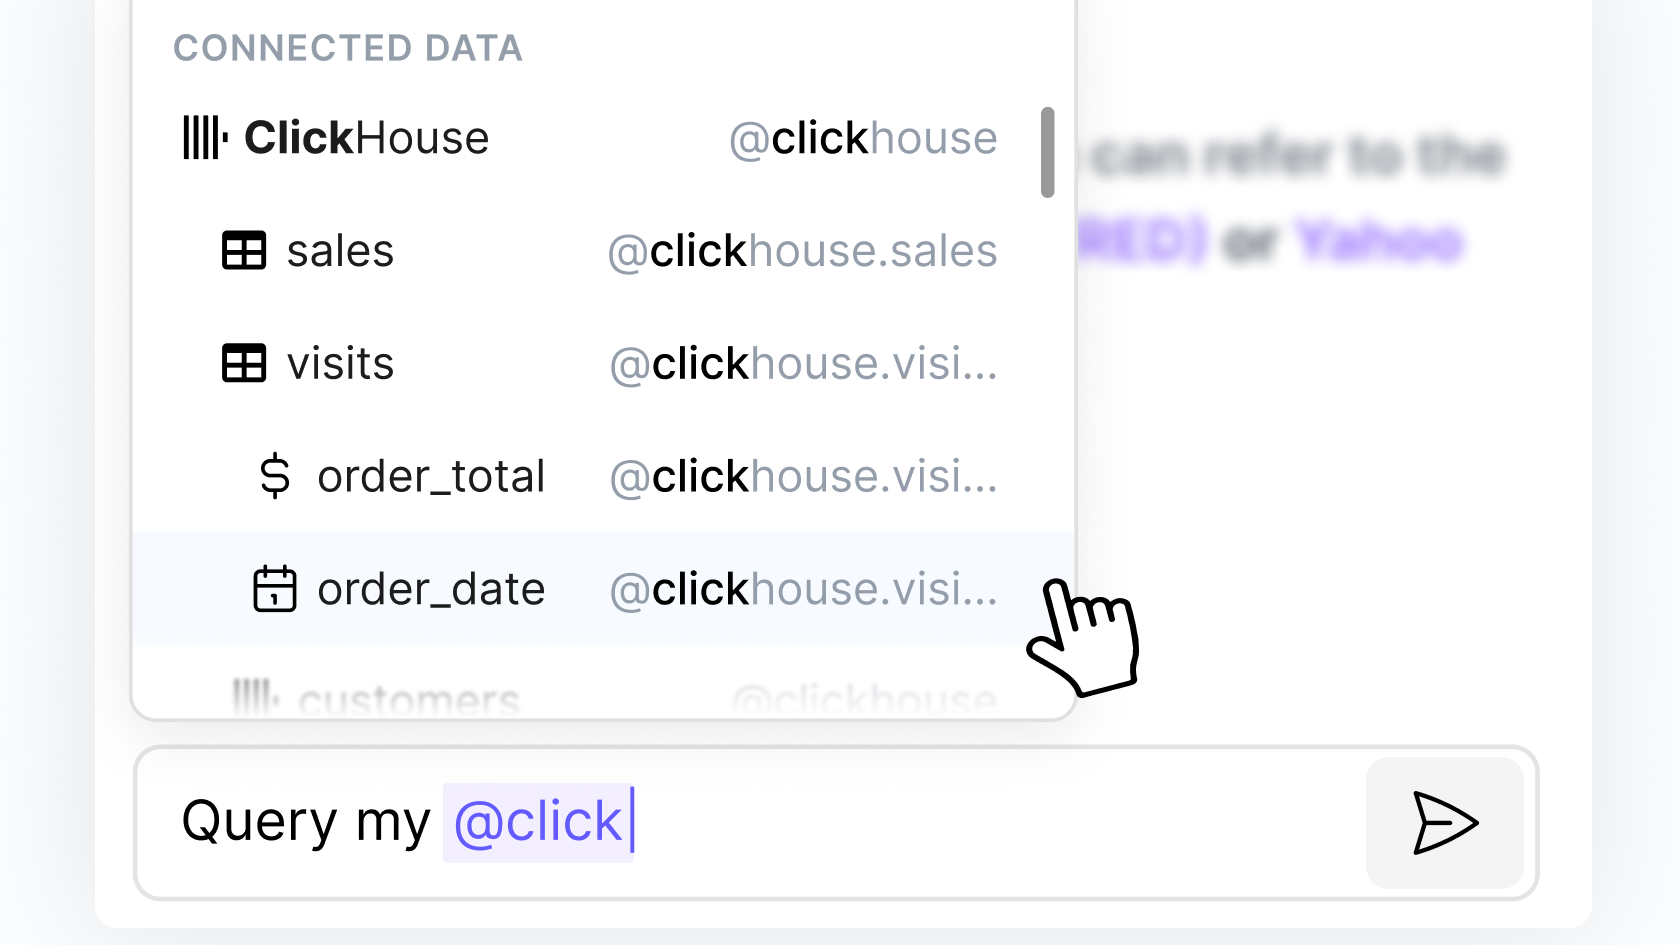
- All your tables appear in the @ picker immediately, with column types
- Queries run the same way they do against Postgres — same SQL syntax, same table references, same joins against your other data sources
- The @ mention resolver understands that @my_clickhouse.events means the events table in your ClickHouse credential
- JOIN ClickHouse tables against Postgres tables or local files like CSVs in the same query (requires remote data fetching for now)
We expect that transaction oriented databases like Postgres and MySQL will remain the workhorses of data reporting due to their popularity (as well as Notion and Airtable too if you squint and pretend they are real databases ; ). Now, you can do cross-source JOINs across those systems, web apps, APIs, MCPs, other databases and ClickHouse.
If you have a ClickHouse database and want to try it, add a credential from the connectors page or paste the connection details into the chat. Your tables will appear in the @ picker as the sync completes in the background.
Once you have tried querying large data in a spreadsheet, it's hard to go back.
Enjoy!
