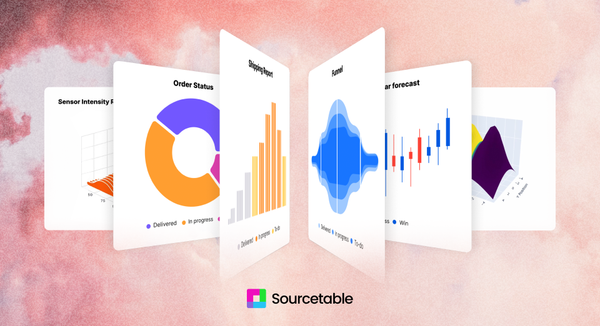
visualizations Charting, Graphing & Interactive Embeds Visualizations upgrades have arrived. Create glossy interactive charts, embeddable iframes, more graphing libraries including Plotly, ECharts, Bokeh, Matplotlib, and Seaborn.