
Perhaps the most surprising learning from talking to users is how often people use the data science features in Sourcetable for research and analysis. From soil science to climatology, oceanography, geology, flurospectronomy and criminology, we're seeing every research field imaginable using Sourcetable.
We built Sourcetable as a flexible AI platform – the Swiss army knife of data analysis, if you will – and focused on universal core primitives: analysis, visualizations, and transforms.
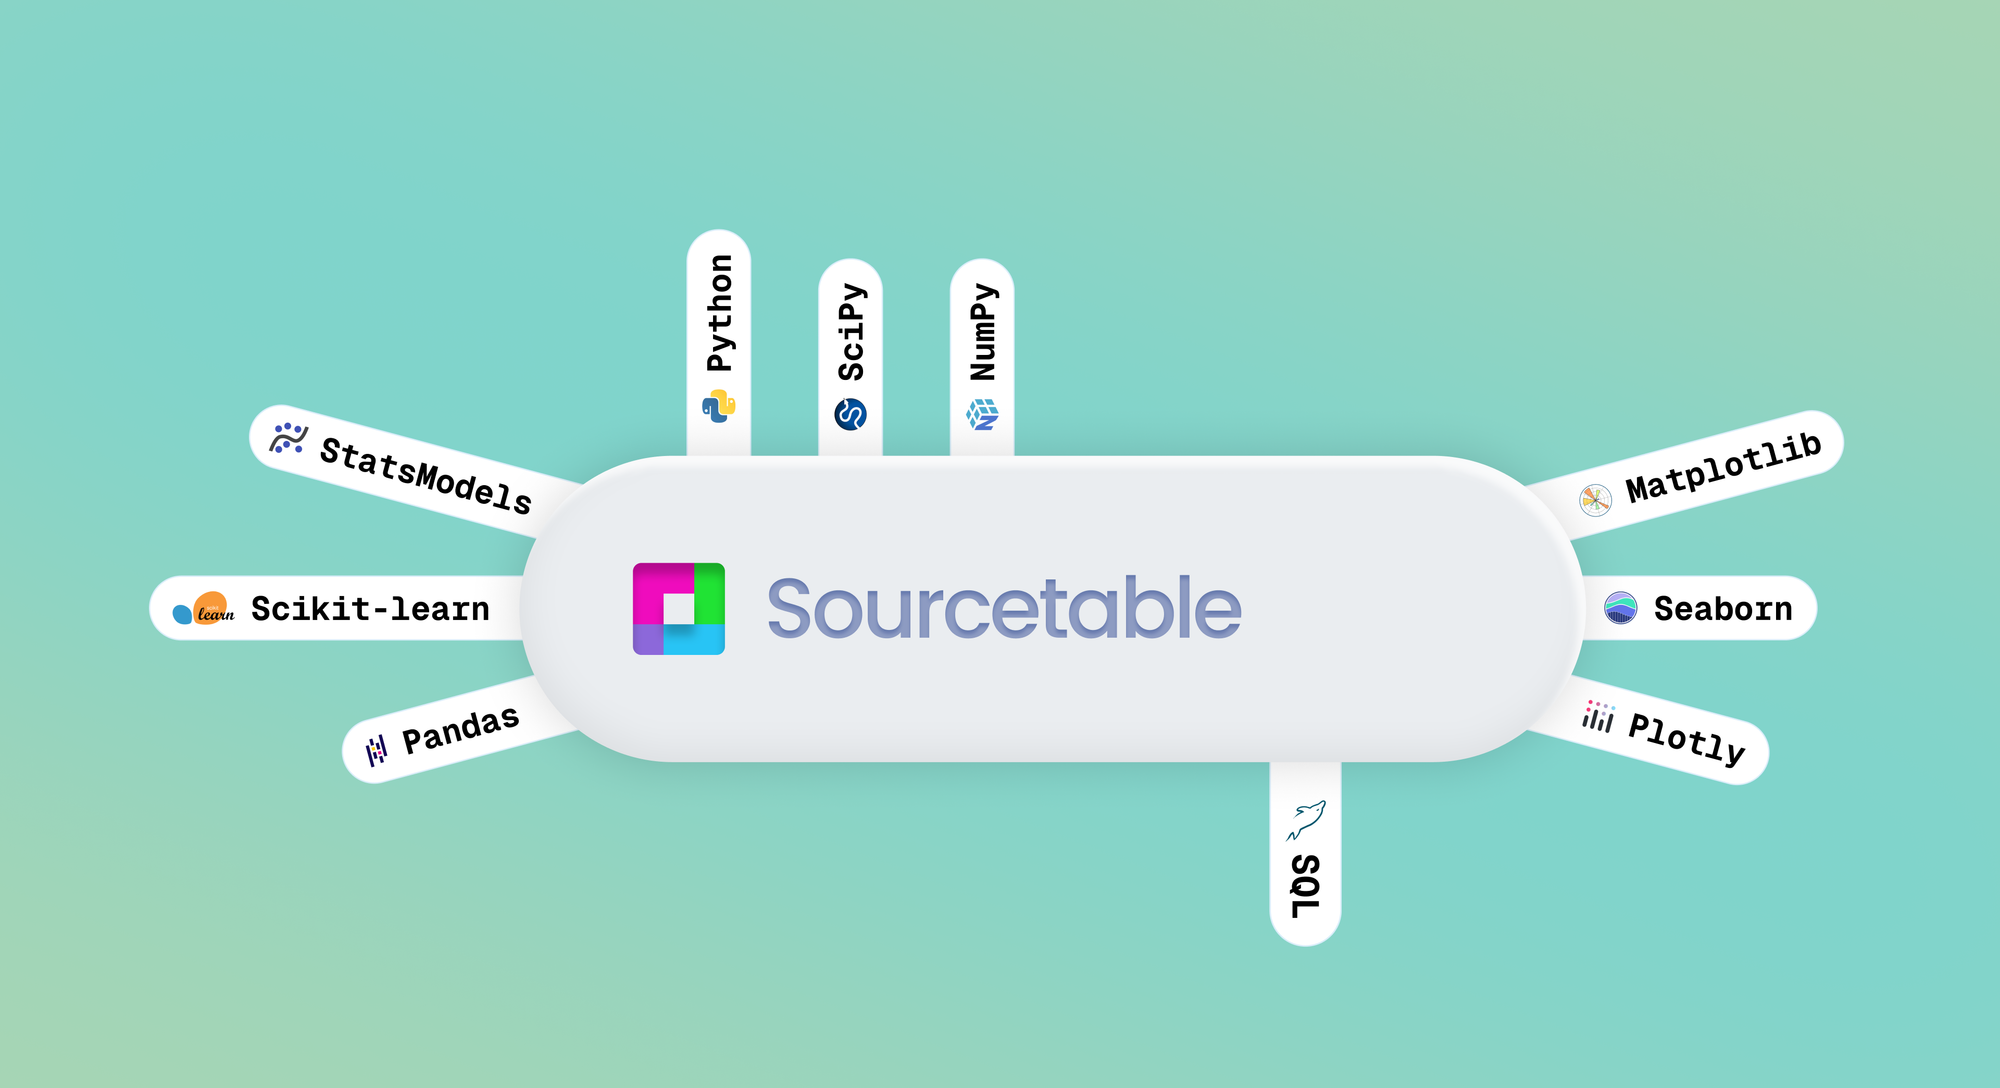
Under the hood, hundreds of tools are available including all of the most popular Python-based data science and visualization libraries. All of these can be used in plain English with Sourcetable's AI.
Visualization Libraries
- Plotly – The GOAT of data science visualizations, Plotly provides graphing and analytics tools, and interative data visualizations.
- Seaborn – Based on matplotlib, Seaborn provides a high-level interface for drawing attractive and informative statistical graphics.
- Matplotlib – comprehensive library for creating static, animated, and interactive visualizations in Python
Data Science Tools
- NumPy – enables fast, efficient operations on multidimensional arrays and matrices.
- SciPy – extends NumPy's algorithms and functions, SciPy is a powerful tool for scientific and engineering applications.
- Scikit-learn – simple and efficient tool for predictive data analysis.
- StatsModels – great for statistical modeling and hypothesis testing, useful for time series analysis, regression diagnostics, linear models, discrete choice models, and more.
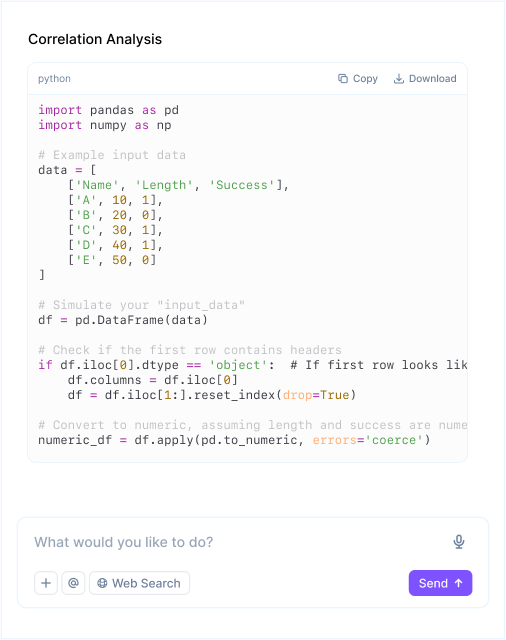
Code Output
Researchers often need to be able to prove their work. Sourcetable will give you the analysis code it wrote, whether it's in Python, SQL, or the underlying A1 notation reference from the spreadsheet itself.
Coming Soon
We're thrilled to see the data science community using Sourcetable. Based on user feedback, the following features were requested and are coming soon:
- 📖 Chat history, for easier repetition of complex tasks.
- 🐍 Easier ability to copy code output, including citations.
- 📊 New charting libraries & interactivity, with easier edits.
As always, the future of spreadsheets is Sourcetable.
Enjoy!