
Analyze data and generate reports without leaving your spreadsheet
Sourcetable added new features that let you analyze your data and export it in multiple formats. Here's what you can do now.
Create and Export Anything
Turn your spreadsheet into professional reports in three formats:
- HTML files - share online or view in any browser
- PDFs - print or email to anyone
- Word documents - edit and customize further
- ... and many more!
If you're tracking gaming stats, working on a database or financial model, or YouTube/Google/Facebook analytics, you can now create polished reports instead of just sharing raw data.
Advanced Analysis Tools
Sourcetable now includes tools for deeper data analysis:
- Leverage Sourcetable's hundreds of AI tools built into the Spreadsheet.
- Predict patterns and export models like Support Vector Machines (SVMs).
- Create data visualizations
- Generate statistical reports
- Export specialized file formats for technical projects
What You Can Use This For
These features work for:
- School and university projects
- Small business financial tracking and reports
- Sports teams and club statistics
- Content creator analytics (YouTube, TikTok, blogs)
- Research and data collection
- Event planning and budget tracking
- Nonprofit organization reporting
- Freelance project management
- Inventory and sales tracking
- Community survey analysis
- Fitness and health tracking
- Stock and investment monitoring
- Financial analysis
- Any time you need to make your data look professional
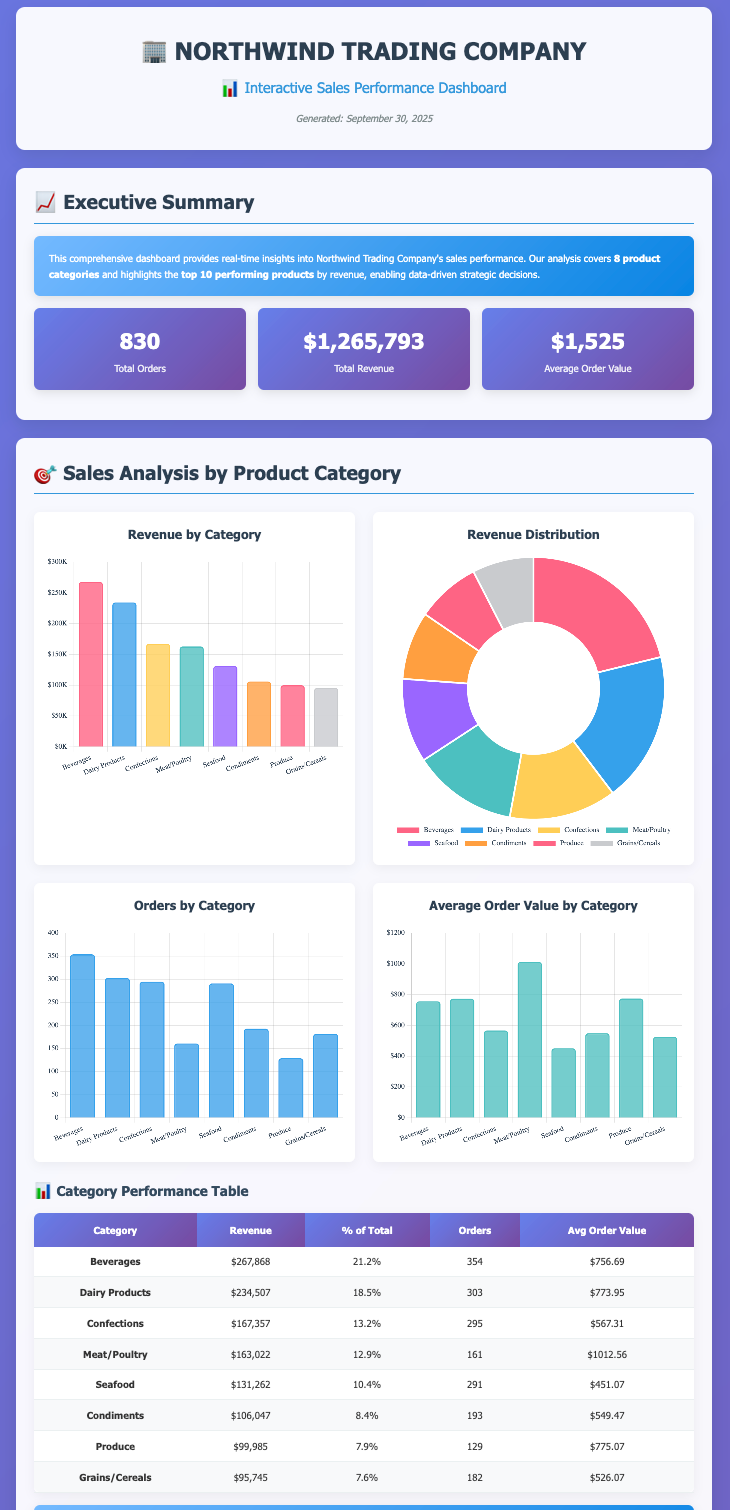
Want an Example?
Here's a real report we generated in HTML that connected to a Supabase database, wrote SQL to retrieve data about our sales tables, and generated this. All options can be customized.
Bottom Line
Sourcetable combined spreadsheets with analytics and export tools. You can analyze data, build models, and create reports all in one place. No need for multiple programs or technical expertise.